Monitoring
Dashboard
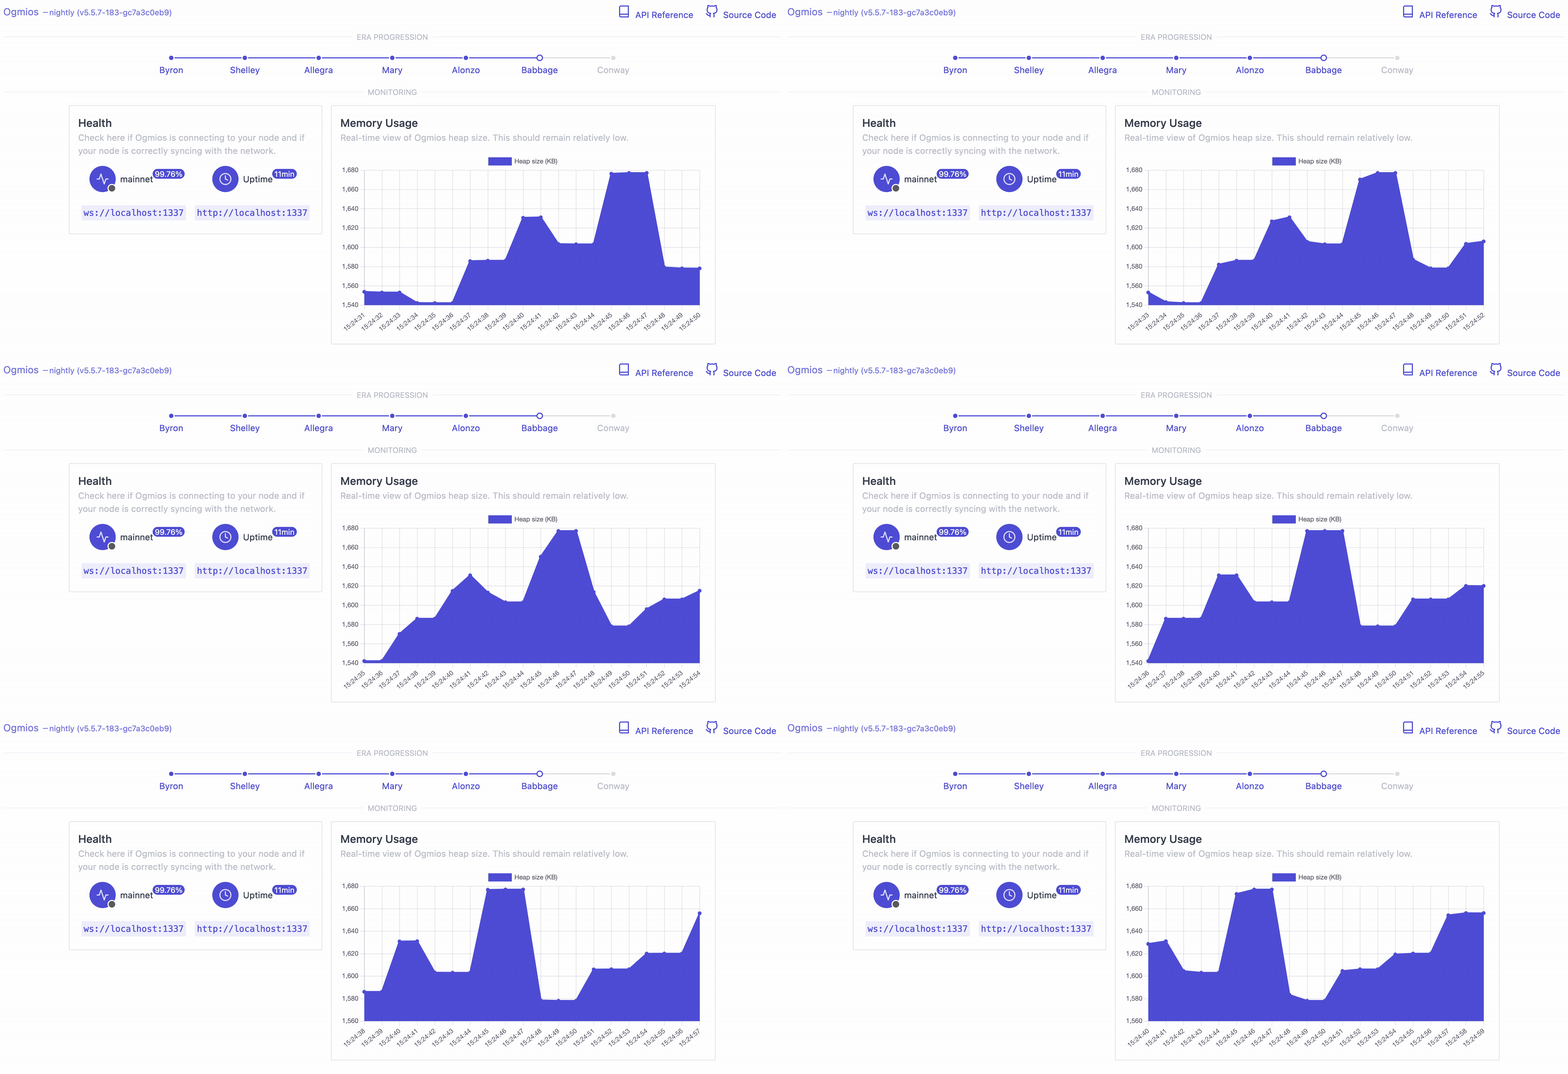
Ogmios offers a simple dashboard through HTTP with a real-time visualization of some of the server runtime metrics. If you’ve Ogmios up-and-running on the default port, visit http://localhost:1337 to view Ogmios' dashboard.

Health / Metrics
Behind the scene, the dashboard is powered by metrics served over HTTP as JSON by the server. Reach /health (e.g. http://localhost:1337/health to get real-time information about your running server, including runtime metrics.
$ curl -H 'Accept: application/json' http://localhost:1337/health
{
    "metrics": {
        "totalUnrouted": 1,
        "totalMessages": 30029,
        "runtimeStats": {
            "gcCpuTime": 1233009354,
            "cpuTime": 81064672549,
            "maxHeapSize": 41630,
            "currentHeapSize": 1014
        },
        "totalConnections": 10,
        "sessionDurations": {
            "max": 57385,
            "mean": 7057,
            "min": 0
        },
        "activeConnections": 0
    },
    "startTime": "2021-03-15T16:16:41.470782977Z",
    "lastTipUpdate": "2021-03-15T16:28:36.853115034Z",
    "lastKnownTip": {
        "hash": "c29428f386c701c1d1ba1fd259d4be78921ee9ee6c174eac898245ceb55e8061",
        "blockNo": 5034297,
        "slot": 15520688
    },
    "networkSynchronization": 0.99,
    "currentEra": "mary",
    "connectionStatus": "disconnected",
    "currentEpoch": 164,
    "slotInEpoch": 324543,
    "version": "6.0.0",
    "network": "mainnet"
}
All information are computed at runtime and not preserved between restarts (at least not yet). The health response includes:
| field | description |
|---|---|
connectionStatus | A string "connected" or "disconnected" indicating whether Ogmios' server is correctly communicating with its underlying node. |
startTime | UTC timestamp at which the server was started. |
lastTipUpdate | UTC timestamp when lastKnownTip was last updated (can be null) |
lastKnownTip | Last known chain tip received from the node (can be null) |
networkSynchronization | A (nullable) percentage indicator of how far the server/node is from the network tip. 1 means it is synchronized. |
currentEra | The (nullable) current Cardano era of the underlying node. Useful for state-queries and debugging. |
currentEpoch | The (nullable) current epoch number known of the underlying node. |
slotInEpoch | The (nullable) relative slot number within the current epoch. |
version | Current Ogmios' version |
network | The network Ogmios is configured for. mainnet, preview or preprod. |
metrics.activeConnections | Number of WebSocket connections currently established with the server. |
metrics.totalConnections | Total number of WebSocket connections established with the server since it’s started. |
metrics.sessionDurations | Some time measures (min, max, mean) of the duration of each sessions, in milliseconds. |
metrics.totalMessages | Total number of messages received from all / any WebSocket connections. |
metrics.totalUnrouted | Total number of invalid messages not routed to one of the mini-protocols, received from all / any WebSocket connections. |
metrics.runtimeStats.gcCpuTime | Time spent by the garbage collector cleaning up previously allocated data objects, in nano-seconds. |
metrics.runtimeStats.cpuTime | Time spent by the CPU doing work (at the last GC), in nano-seconds. |
metrics.runtimeStats.maxHeapSize | Maximum live data allocated in the heap, in kilo-bytes. |
metrics.runtimeStats.currentHeapSize | Current live data allocated in the heap, in kilo-bytes. |
All dates / timestamps are given as ISO-8601 date-time strings.
Runtime metrics (i.e. runtimeStats) are only available when the server is started with the +T runtime flag. This is the case by default, but can be manually turned on and off using the +RTS / -RTS options. For example ogmios --node-socket /path/to/socket +RTS -T -RTS will run Ogmios with runtime stats activated.
Prometheus Metrics
Ogmios also provides Prometheus metrics directly at http://localhost:1337/metrics.
The Connected connection status is encoded as ogmios_connected 1
while disconnected as ogmios_connected 0.
$ curl http://localhost:1337/metrics
# TYPE ogmios_active_connections gauge
ogmios_active_connections  0.0
# TYPE ogmios_connected gauge
ogmios_connected  1.0
# TYPE ogmios_cpu_time counter
ogmios_cpu_time  3841629783
# TYPE ogmios_current_epoch counter
ogmios_current_epoch  363
# TYPE ogmios_current_heap_size gauge
ogmios_current_heap_size  390.0
# TYPE ogmios_gc_cpu_time counter
ogmios_gc_cpu_time  3142668337
# TYPE ogmios_max_heap_size gauge
ogmios_max_heap_size  433.0
# TYPE ogmios_network_synchronization gauge
ogmios_network_synchronization  0.99999
# TYPE ogmios_session_duration_max gauge
ogmios_session_duration_max  0.0
# TYPE ogmios_session_duration_mean gauge
ogmios_session_duration_mean  0.0
# TYPE ogmios_session_duration_min gauge
ogmios_session_duration_min  0.0
# TYPE ogmios_slot_in_epoch counter
ogmios_slot_in_epoch  150361
# TYPE ogmios_tip_block counter
ogmios_tip_block  7756720
# TYPE ogmios_tip_slot counter
ogmios_tip_slot  71603161
# TYPE ogmios_total_connections counter
ogmios_total_connections  0
# TYPE ogmios_total_messages counter
ogmios_total_messages  0
# TYPE ogmios_total_unrouted counter
ogmios_total_unrouted  0